Authors: Lostin & 0xIchigo (Helius)
Summary
This SIMD proposes updating the inflation schedule by increasing the disinflation rate from -15% to -30%, effectively doubling the pace of inflation decline.
Our modeling indicates this will have the following effects:
-
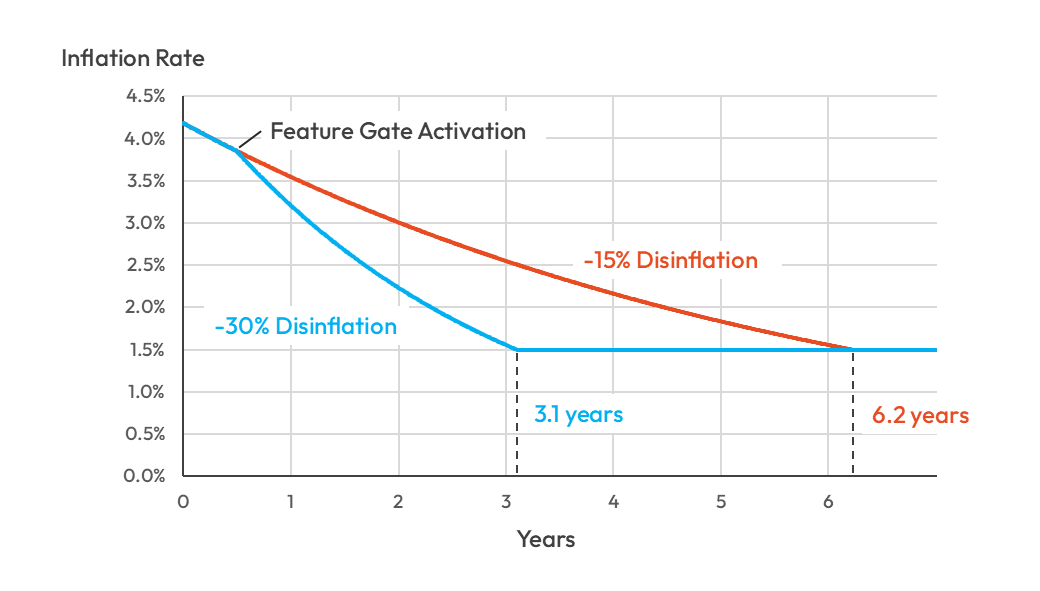
Reach the terminal inflation rate of 1.5% in 3.1 years (early 2029) instead of 6.2 years (early 2032)
-
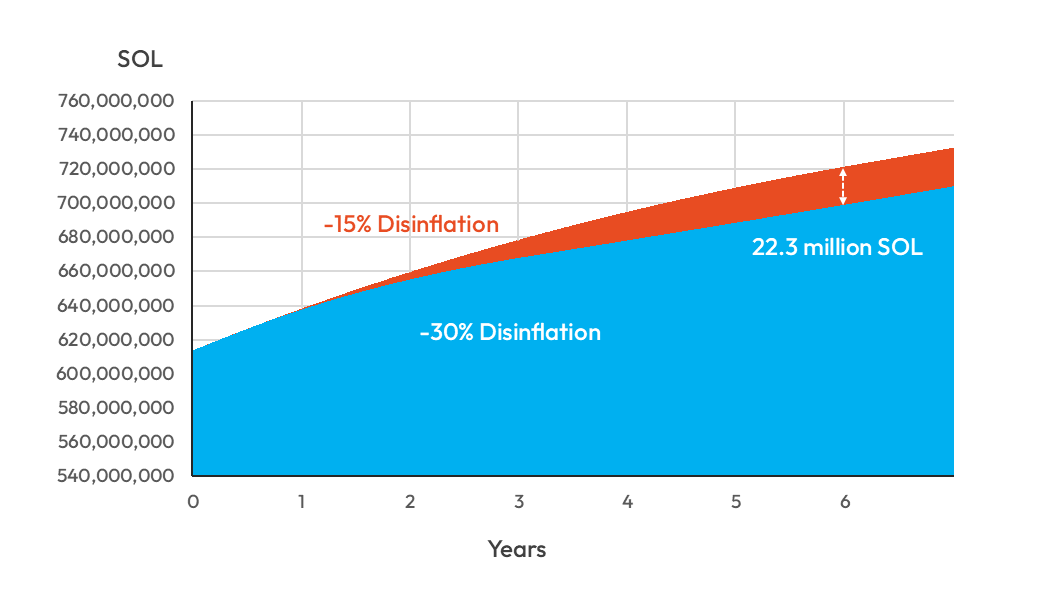
Reduce emissions by 22.3 million SOL ($2.9 billion) over six years
-
Bring nominal staking yields from the current 6.41% to 5.04% in year one, 3.48% in year two, and 2.42% in year three.
-
Have a muted impact on the number of profitable validators, with 10 validators out of 845 transitioning from profitable/breakeven to unprofitable in year one, 27 in year two, and 47 in year three.+
Motivation
The core motivation for this proposal is to materially reduce Solana’s emissions schedule. Unlike SIMD-228, doubling the disinflation rate takes a fundamentally different approach to emissions reduction, with the following benefits:
Simplicity: Doubling the disinflation rate requires modifying a single parameter, making it the simplest possible protocol change that delivers a meaningful reduction in inflation. This adjustment is straightforward to implement and will not consume core developer resources. It carries minimal risk of introducing bugs or unforeseen edge cases.
Because the adjustment is intuitive, it can be easily communicated to all stakeholder groups, including retail stakers, non-crypto native institutions, and regulators, regardless of their technical background.
Predictability: Unlike dynamic inflation mechanisms, the effects of doubling the disinflation rate are predictable and easy to model. This provides strong certainty around future inflation and emissions. The adjustment gradually reduces emissions over many years, avoiding abrupt shocks to the network or the economic system. The original long-term inflation target (1.5%) remains unchanged; this proposal merely accelerates the path to that established equilibrium.
Supply Reduction: Our modeling indicates that, over the next 6 years, total supply would be approximately 3.2% lower (a reduction of 22.3 million SOL) than under the current inflation schedule. At today’s SOL price, this equates to roughly $2.9 billion in reduced emissions. Excessive emissions create persistent downward price pressure, distorting market signals and hindering fair price comparison.
Plugging the Leaky Bucket: High token inflation increases sell pressure, as some stakers, especially in certain jurisdictions, treat staking rewards as ordinary income and need to sell a portion to cover taxes. Max Resnick’s analysis outlined a 17% “leaky bucket” tax on inflation (i.e., the gap between ordinary income and the 20% long-term capital gains rate). Combined with governments, centralized exchanges, and custody providers taking significant cuts of staking rewards, even small reductions in issuance can save the network hundreds of millions of dollars per year.
DeFi Usage: High inflation increases the opportunity cost of deploying SOL in DeFi, discouraging participation in lending, trading, and liquidity provision. The effect mirrors traditional finance: higher interest rates raise the risk-free rate and reduce borrowing and spending. In Solana’s case, the “risk-free rate” is the native staking yield.
Flexibility: This adjustment does not preclude the community from adopting more sophisticated, dynamic, or market-driven emission systems at a later date, should they be desired.
Why Double?
Any adjustment to the inflation schedule must be significant enough to materially reduce emissions, yet moderate enough to avoid introducing shocks to the system. Doubling the disinflation rate is a straightforward, balanced way to achieve these goals.
The idea itself is not novel, having been independently proposed multiple times (e.g., 1, 2, 3, 4).
Design
Three parameters define Solana’s current inflation schedule:
-
Initial Inflation Rate: 8%
-
Disinflation Rate: -15%
-
Long-term Inflation Rate: 1.5%
As of mid-November, the inflation rate stands at 4.18%. Under the current disinflation schedule of -15% per year, it will take approximately 6.2 years (early 2032) to reach the terminal rate. Doubling the disinflation rate to -30% significantly shortens this timeline, bringing the network to its long-term terminal inflation rate in roughly 3.1 years (early 2029). This assumes a 6-month lag period before any change is activated to account for the governance process and Alpenglow update. This provides a reasonable timeline that addresses concerns about inflation, without introducing systemic shock to an already shrinking validator set.
Yearly comparisons are provided below, with full numbers in this sheet.
| Period | Current Disinflation (-15%) | Proposed Disinflation (-30%) |
|---|---|---|
| Current | 4.18% | 4.18% |
| After 1 year | 3.55% | 3.21% |
| After 2 years | 3.01% | 2.24% |
| After 3 years | 2.55% | 1.56% |
| After 4 years | 2.16% | 1.50% |
| After 5 years | 1.84% | 1.50% |
| After 6 years | 1.56% | 1.50% |
Side Note: The inflation schedule assumes 180 epochs per year, corresponding to the protocol’s target 400 ms slot time (approximately 2 days per epoch). In practice, however, actual slot times were significantly longer, particularly throughout 2021–2023, meaning epochs took much more than 2 days to complete. Only since epoch 718 has the network consistently hit 2-day epochs.
As a result, the current inflation schedule is behind the intended timeline. When comparing actual epoch durations to the expected 2-day cadence, the network is currently running 282 days behind where inflation would be if epochs had matched the target duration.
Impact
Reduced Emissions
Doubling the disinflation rate results in an estimated total supply of 699.19 million SOL after six years, 22.3 million SOL lower (3.2%) than under the current inflation path. At current SOL prices, this is a $2.9 billion reduction in emissions. Following the implementation of SIMD-0096, the share of issuance offset by burned transaction base fees is negligible (see chart) and has been excluded from this analysis. Full numbers in this sheet.
| Period | Current -15% | Proposed -30% |
|---|---|---|
| Current (mid Nov 2025) | 613,823,198 | 613,823,198 |
| After 1 year | 638,226,790 | 637,661,546 |
| After 2 years | 659,812,163 | 655,389,900 |
| After 3 years | 678,584,933 | 667,958,800 |
| After 4 years | 695,015,051 | 678,245,313 |
| After 5 years | 709,181,881 | 688,610,002 |
| After 6 years | 721,490,711 | 699,191,341 |
| Period | Difference (SOL) | Difference (%) |
|---|---|---|
| Current (mid Nov 2025) | 0 | 0% |
| After 1 year | 565,243.98 | 0.09% |
| After 2 years | 4,422,263.36 | 0.67% |
| After 3 years | 10,626,133.08 | 1.6% |
| After 4 years | 16,769,737.54 | 2.47% |
| After 5 years | 20,571,879.01 | 2.99% |
| After 6 years | 22,299,369.53 | 3.2% |
Nominal Staking Yields
Nominal staking yields were modeled under three plausible staking participation scenarios, 60%, 66%, and 72%, which reflect historical staking ranges (see chart). These modeled yields represent the baseline nominal returns of staking, excluding commissions or additional yield sources such as MEV and block rewards. They can be considered a worst-case scenario for staking yield in the event of very low network activity.
At the mid-range assumption of a 66% staking rate (which closely reflects current conditions), nominal staking yields decline by roughly 0.8% after one year under a -15% disinflation scenario, and by about 1.4% under a -30% disinflation scenario. The table and chart below provide full year-over-year comparisons. Full numbers in this sheet.
| Period | Current Schedule | Proposed Schedule |
|---|---|---|
| 72% / 66% / 60% | 72% / 66% / 60% | |
| Current (mid Nov 2025) | 6.41% | 6.41% |
| After 1 year | 5.11% / 5.59% | 4.61% / 5.04% |
| / 6.16% | / 5.56% | |
| After 2 years | 4.31% / 4.72% | 3.19% / 3.48% |
| / 5.20% | / 3.84% | |
| After 3 years | 3.65% / 3.99% | 2.21% / 2.42% |
| / 4.39% | / 2.66% | |
| After 4 years | 3.08% / 3.37% | 2.13% / 2.32% |
| / 3.71% | / 2.56% | |
| After 5 years | 2.61% / 2.85% | 2.13% / 2.32% |
| / 3.14% | / 2.56% | |
| After 6 years | 2.20% / 2.41% | 2.13% / 2.32% |
| / 2.65% | / 2.56% |

Validator Break-Even Stake Requirement
Using the following code, we can model the effect of this proposal on validator profitability. We assume $18,000 USD/year—based on server costs, an average commission of 2.75%, a SOL price of $130 USD, and annual voting costs of 201 SOL (i.e., Alpenglow’s VAT * 182.5 epochs, rounded to the nearest whole number). Using the current inflation rate (i.e., 4.185%), we can make a simple model of this proposal’s effects.
Ceteris paribus, we find the following for the amount of SOL a validator needs to stake to break even under the following scenarios:
| Year | Current -15% | 6mo Grace + -30% |
|---|---|---|
| 0 | 199,000 | 199,000 |
| 1 | 234,000 | 234,000 |
| 2 | 276,000 | 335,000 |
| 3 | 325,000 | 479,000 |
| 4 | 382,000 | 556,000 |
| 5 | 449,000 | 556,000 |
| 6 | 528,000 | 556,000 |
| 7 | 556,000 | 556,000 |
Eventually, according to our assumptions outlined above, all validators would need at least 556,000 SOL to break even in the long term due to the 1.5% inflation floor. The 6-month grace period before doubling the disinflation rate to -30% attains this break-even amount in 3.1 years, compared to the current schedule’s six, without introducing the same intensity of shocks as immediately doubling the disinflation rate.
Validator Set Profitability
In this spreadsheet, we captured real mainnet rewards data from a recent epoch (878) via the Trillium API, then evaluated validator profitability by estimating operational costs and totaling revenue across three sources: Jito MEV tip commissions, block rewards, and inflation reward commissions.
We compared how the number of profitable validators would change as inflation rewards decrease over six years, under both the -15% and -30% disinflation schedules.
Outside the supermajority, 54.7% of validators rely on inflation commissions for 30% or less of their income, with 49.3% having inflation commissions set to 0%.
With -30% disinflation, the number of validators who went from profitable or breakeven to unprofitable was 10 in year one, 27 in year two, and 47 in year three. After year three, the terminal rate is met, with no further changes in profitability.
Profitability at -15% disinflation
| Category | Current | Year 1 | Year 2 | Year 3 |
|---|---|---|---|---|
| Profitable validators | 508 | 498 | 489 | 478 |
| Breakeven validators | 32 | 38 | 35 | 41 |
| Unprofitable validators | 305 | 309 | 321 | 326 |
| Total Validators | 845 | 845 | 845 | 845 |
| Increase unprofitable | 0 | 4 | 16 | 21 |
| Category | Year 4 | Year 5 | Year 6 |
|---|---|---|---|
| Profitable validators | 472 | 468 | 460 |
| Breakeven validators | 38 | 35 | 33 |
| Unprofitable validators | 335 | 342 | 352 |
| Total Validators | 845 | 845 | 845 |
| Increase unprofitable | 30 | 37 | 47 |
Profitability at -30% disinflation
| Category | Current | Year 1 | Year 2 | Year 3 |
|---|---|---|---|---|
| Profitable validators | 508 | 493 | 472 | 460 |
| Breakeven validators | 32 | 37 | 41 | 33 |
| Unprofitable validators | 305 | 315 | 332 | 352 |
| Total Validators | 845 | 845 | 845 | 845 |
| Increase unprofitable | 0 | 10 | 27 | 47 |
| Category | Year 4 | Year 5 | Year 6 |
|---|---|---|---|
| Profitable validators | 458 | 458 | 458 |
| Breakeven validators | 34 | 34 | 34 |
| Unprofitable validators | 353 | 353 | 353 |
| Total Validators | 845 | 845 | 845 |
| Increase unprofitable | 48 | 48 | 48 |
Security Considerations
As staking yields decline, the network’s staking rate (i.e., currently 68%) could fall below levels considered optimal for security. However, this same dynamic would also occur under the current inflation schedule, since the terminal inflation rate of 1.5% remains unchanged. This proposal simply brings the network to those long-term rates sooner. Any challenges arising from lower yields would therefore need to be addressed regardless of whether the timeline is accelerated. The accelerated -30% disinflation schedule still takes multiple years to reach the terminal rate, providing ample time to make further adjustments if required.
Drawbacks
SOL’s relatively high nominal yield has made it appealing to certain retail and traditional finance investors, some of whom characterize it as “a high-growth stock with a bond.” Increasing the disinflation rate will cause this yield advantage to diminish more quickly than it otherwise would.
Reduced emissions may lead to a contraction in the validator set among operators who depend on staking commissions to cover their operational expenses. As staking rewards decline, a subset of validators may find it increasingly challenging to remain economically sustainable, potentially impacting overall validator diversity.
Previous governance discussions on modifying the inflation schedule became unusually heated and divisive, ultimately diverting attention away from more productive ecosystem work. With this proposal, we aim to avoid repeating those missteps and promote a more constructive and focused governance process.
Alternatives Considered
Directly Adjust the Inflation Rate
Altering the inflation rate itself, rather than the disinflation curve, would also require a change large enough to affect emissions meaningfully. However, such a direct adjustment is likely too aggressive. Even with a phase-in period, a substantial one-off reduction to the base inflation rate could introduce undesirable shocks to the system and create uncertainty for validators, stakers, and DeFi protocols that rely on staking yield.
Dynamic Issuance Curves
Dynamic, market-based systems introduce additional complexity into the protocol. They also have less predictability around future emissions and staking rewards. While SIMD-228 did receive majority support, it failed to meet the required governance threshold.
Voting Process
We strongly prefer that any governance vote for this proposal include both validators and SOL token stakers. New governance tooling enabling this participation model is expected to be available shortly after Breakpoint. Once it is live, we will update the voting process and timeline sections accordingly.
Timeline
This proposal is currently under discussion.
Voting timeline TBD.
Discussion
Active participation in discussions about this proposal is crucial. Discussions may also take place on the SIMD-0411 pull request and in the Solana Tech Discord.
References
https://github.com/solana-foundation/solana-improvement-documents/pull/411